A report is a list of records that meet the criteria you define. It’s displayed in Salesforce in rows and columns, and can be filtered, grouped, or displayed in a graphical chart.
Every report is stored in a folder. Folders can be public, hidden, or shared, and can be set to read-only or read/write. Improving your Salesforce reporting can help you make more informed decisions about your sales and marketing strategies, your internal operations and your customer service. The metrics can help you identify weaknesses. But, these reports can also help you find what’s working and resonating with your end users and customers.
Here are our top reports:
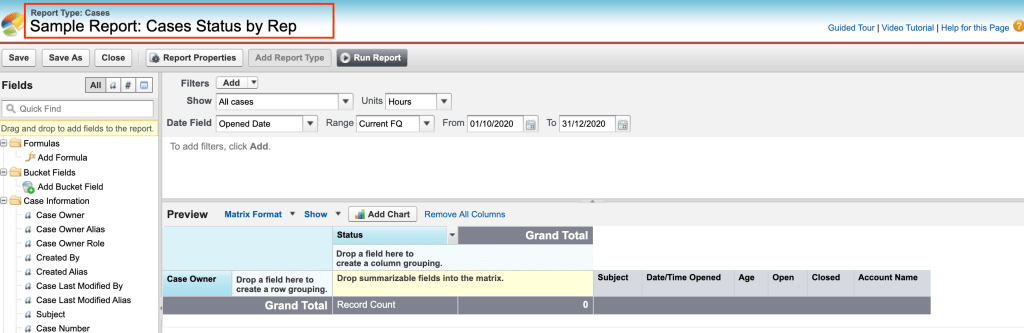
- Cases Status by Rep – (Who has the most Open Cases?)
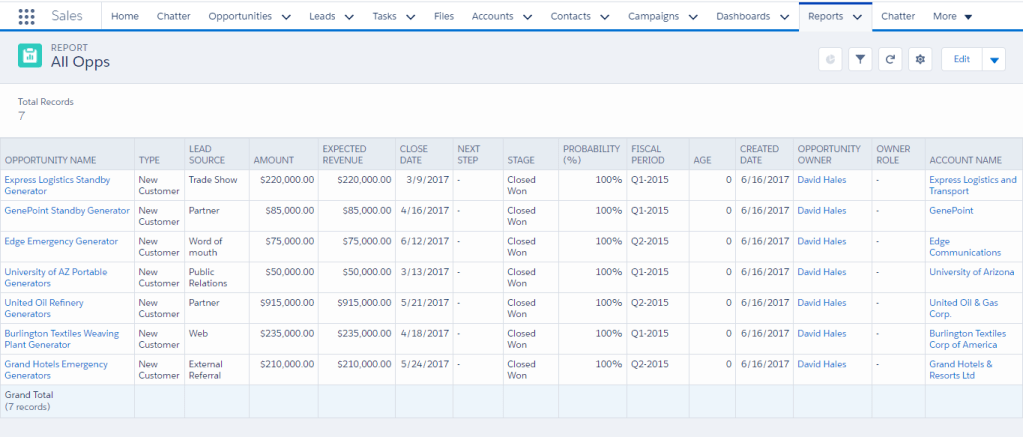
2. Closed Sales report – (How much business have I closed so far?)

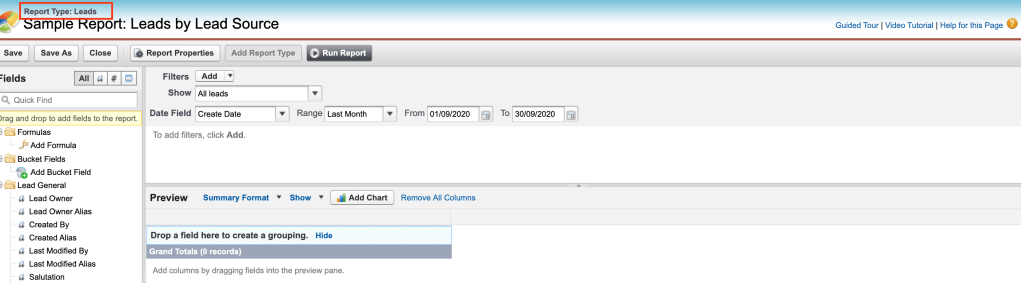
3. Leads by leads source – (How many leads has each lead source generated for me?)
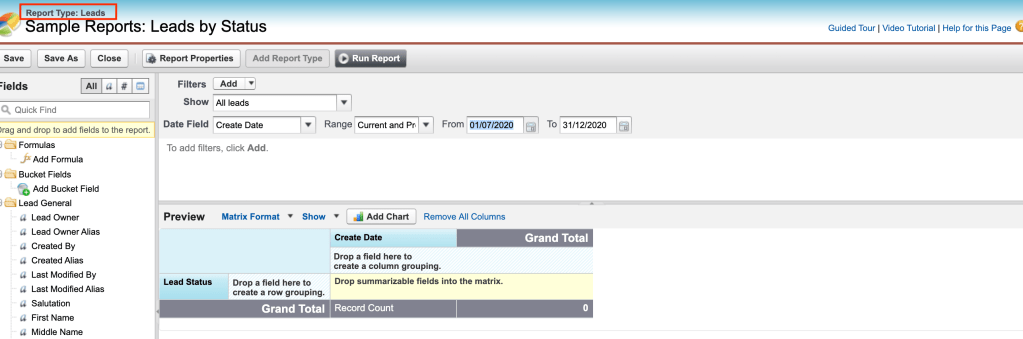
4. Leads Status – (What is the Status of Leads created this quarter?)
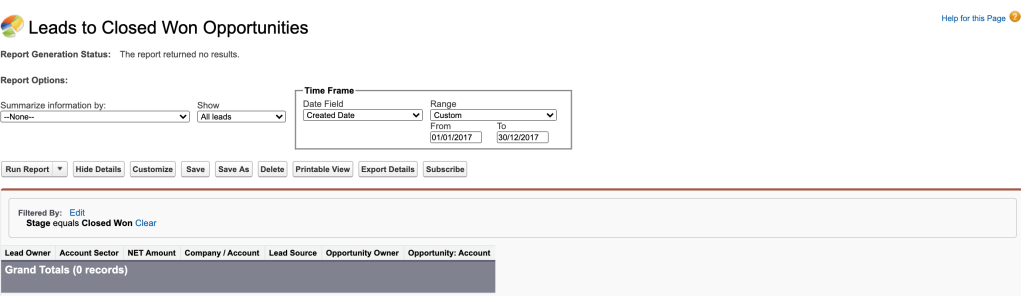
5. Leads to Closed Won Opportunities
6. Number of Leads – (How do Sales this month correlate to prior months?)
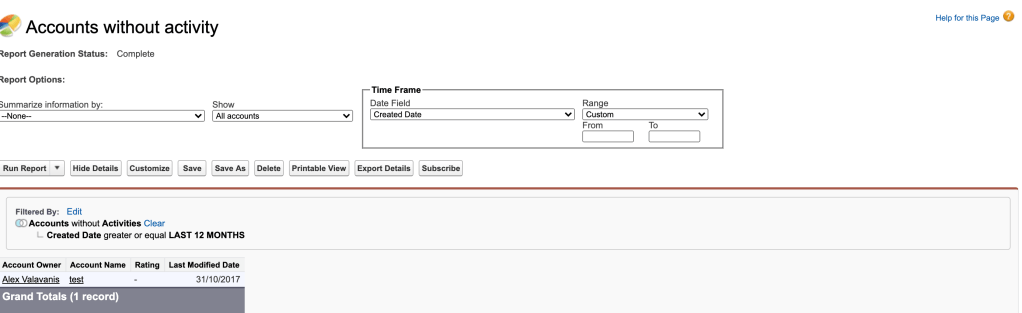
7. Accounts without Activity
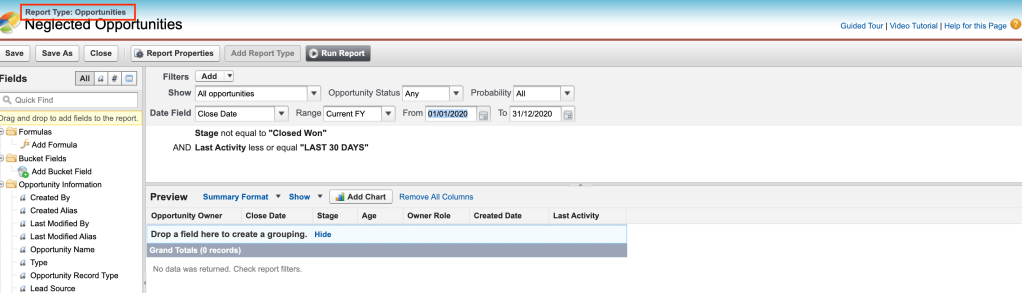
8. Neglected Opportunities – (Ensure that Opportunities get followed up thoroughly)
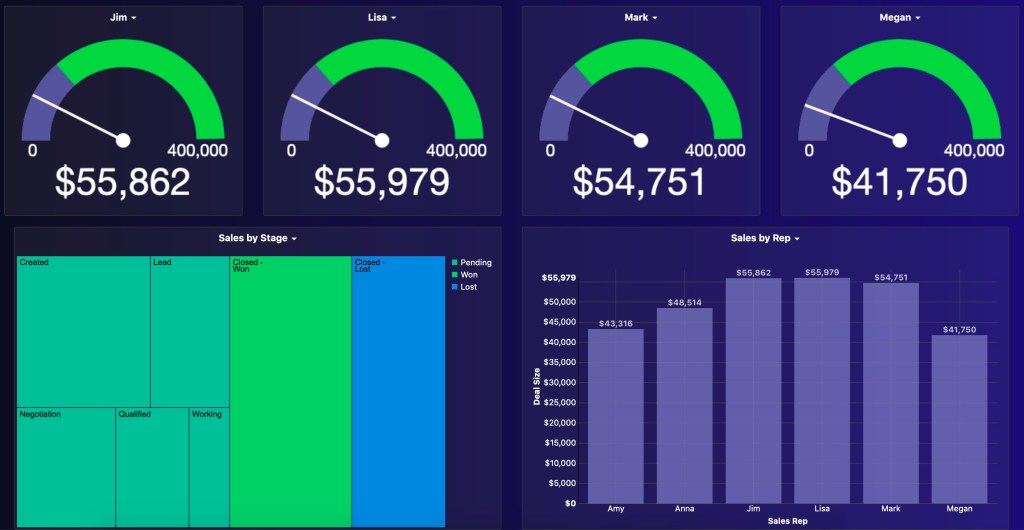
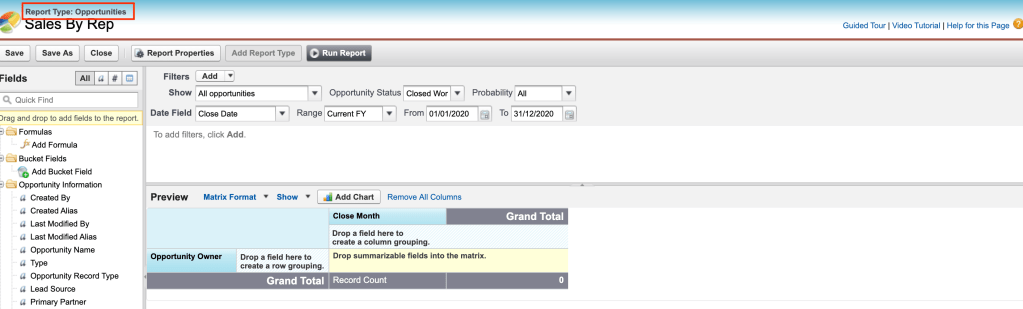
9. Sales by Rep – (What is the Total Sales per Rep?)
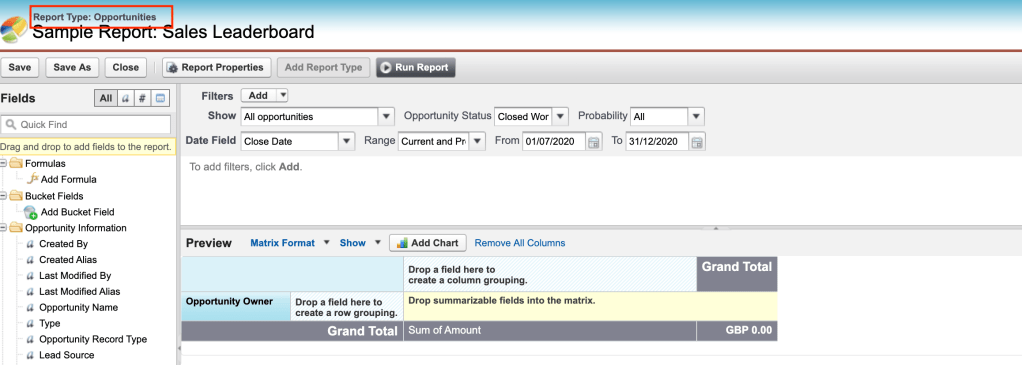
10. Sales Leaderboard – (Who are my top sales rep?)
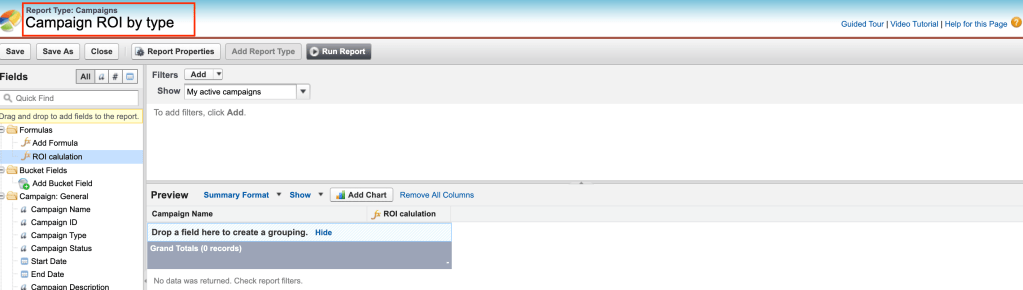
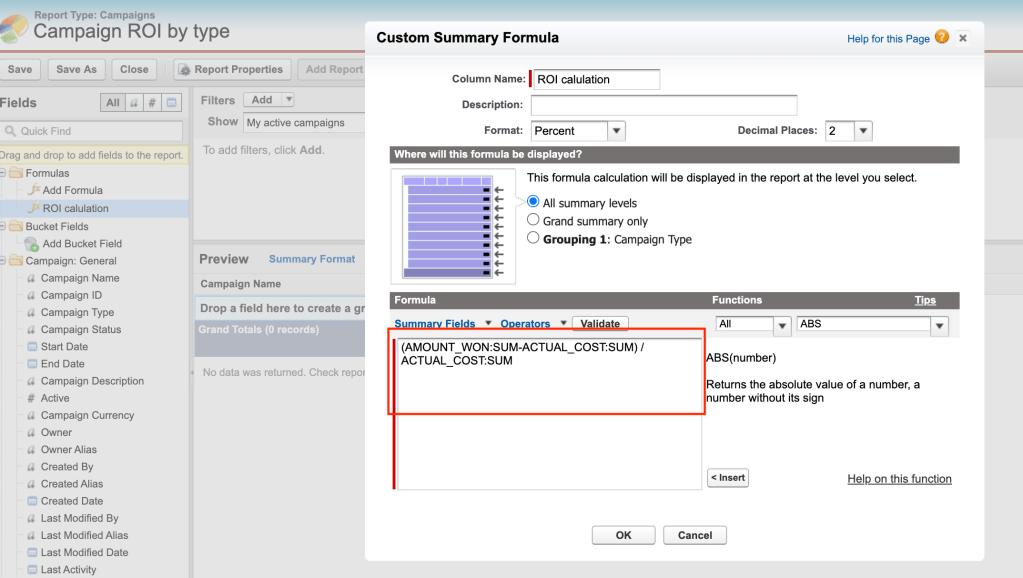
11. Campaign ROI by Type
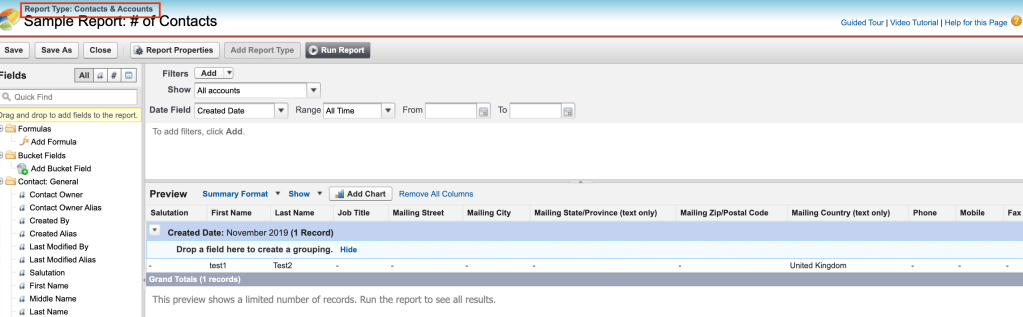
12. Number of Contacts – (How many contacts do we have in Salesforce?)
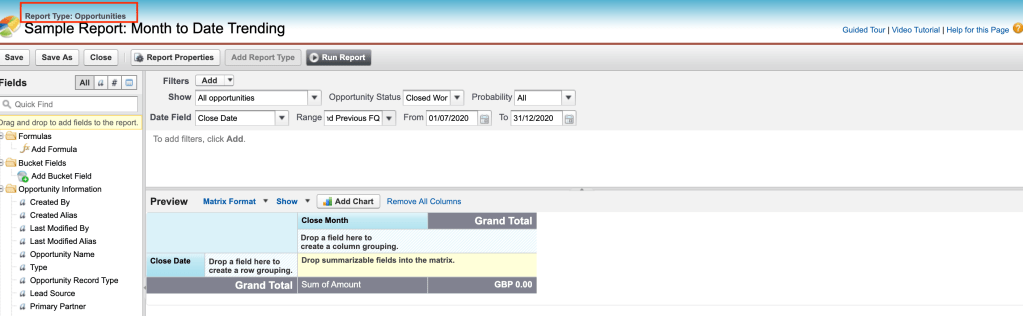
13. Month to Date Trending – (How do Sales this month correlate to prior months?)

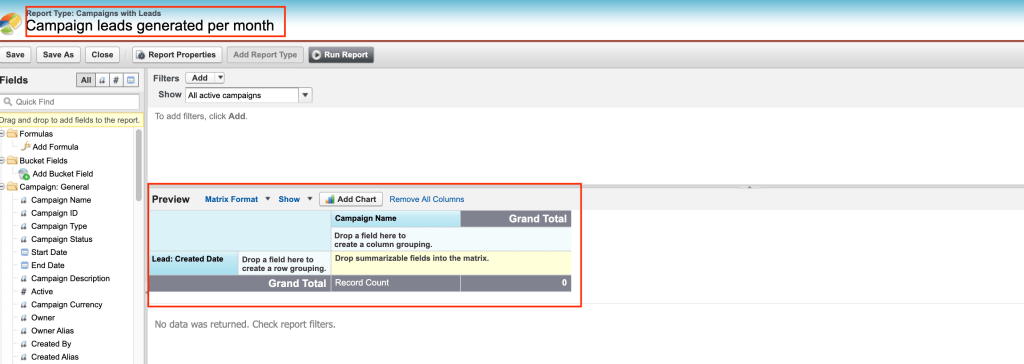
14. Campaign Leads generated per month
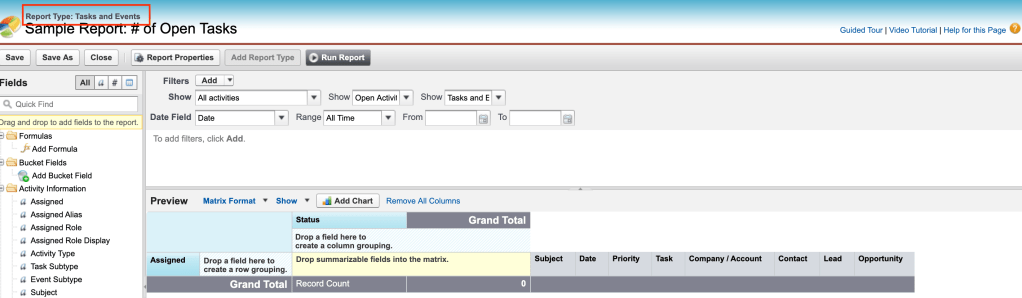
15. Number of Open Tasks – (How many Tasks do each of my users have?)
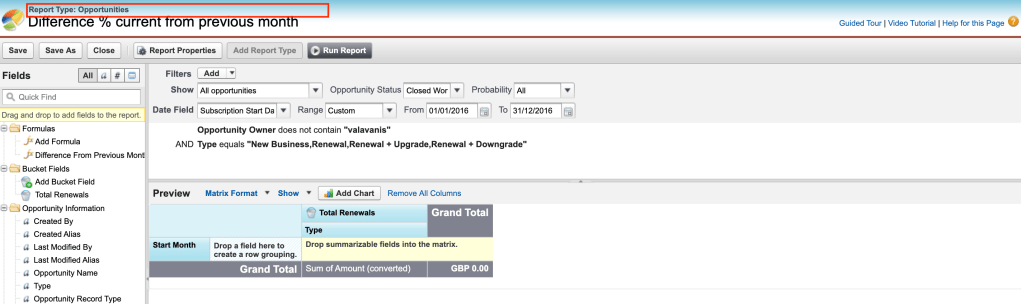
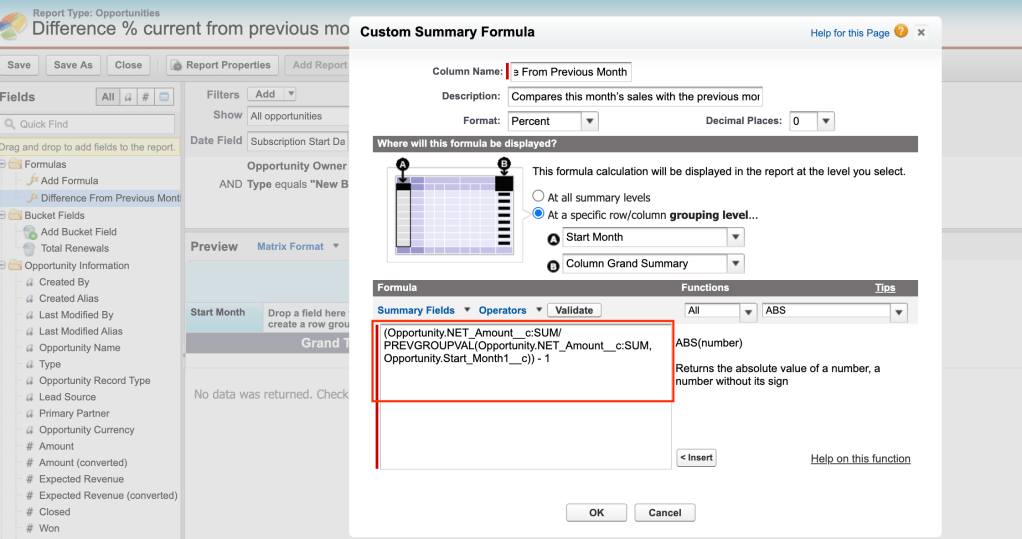
16. Difference % current from previous month
17. Top 5 Campaigns by revenue

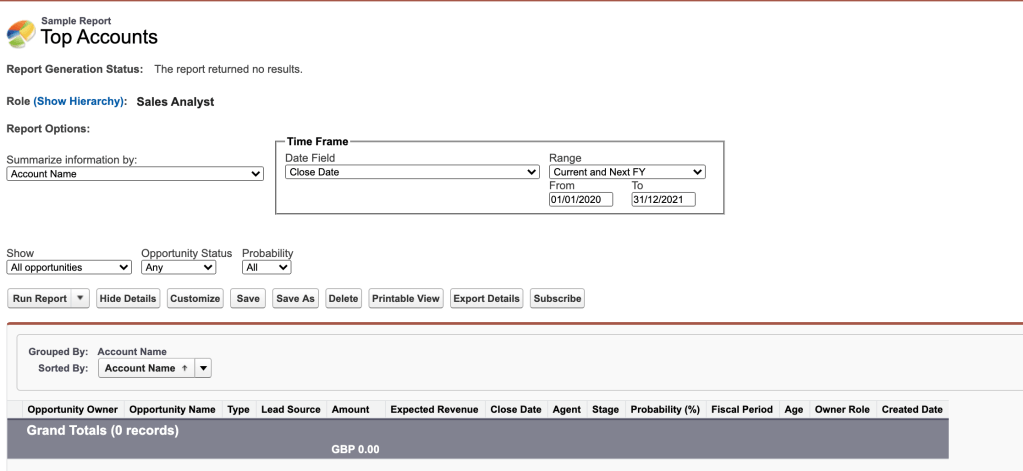
18. Top Accounts – (Which Accounts are generating the most revenue?)
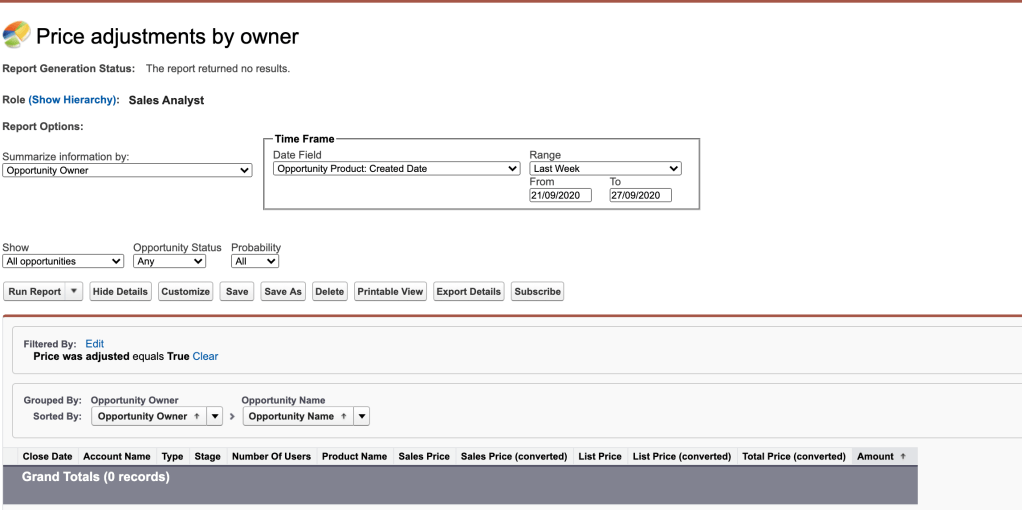
18. Price adjusted by Owner
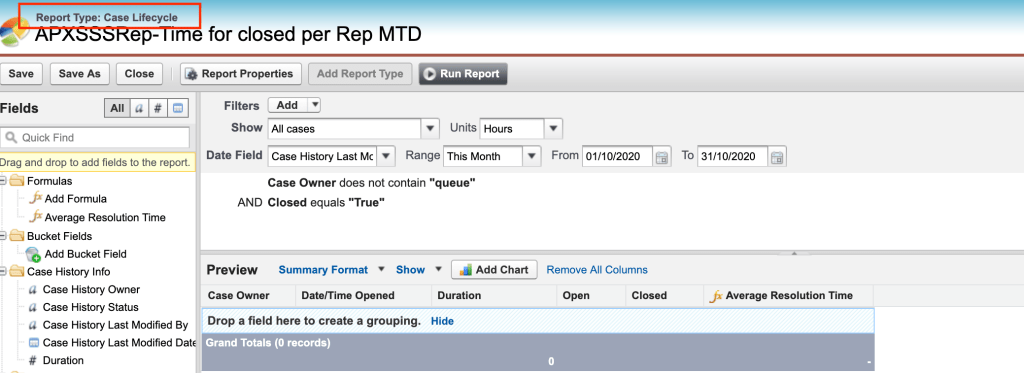
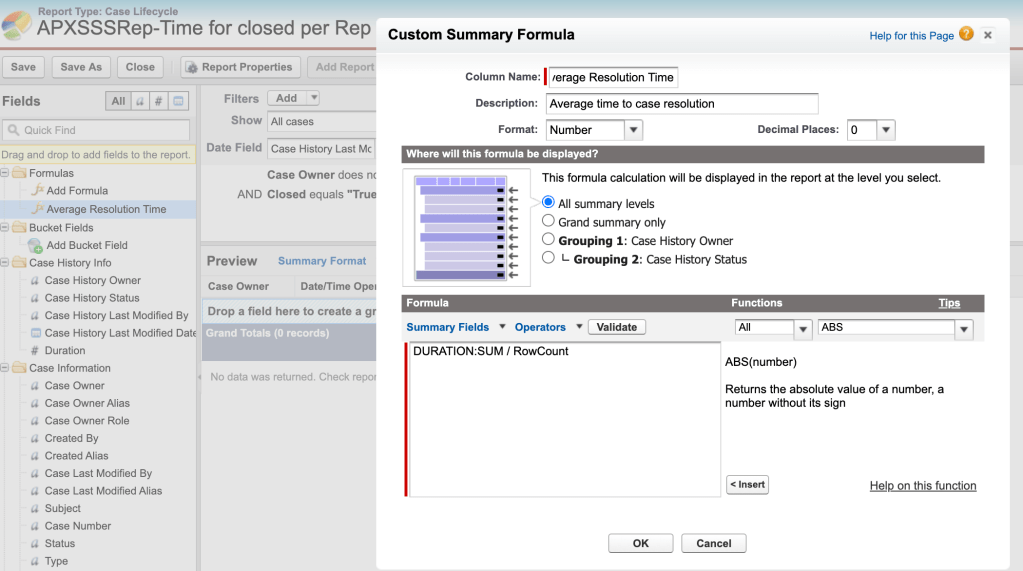
19. Time for Closed Cases per Rep MTD – (How much time did a rep spend on closed cases?)
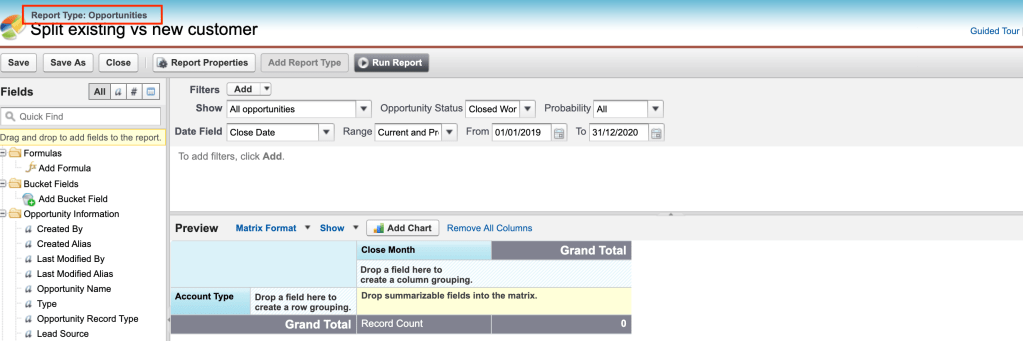
20. Split Existing vs New Customer – (How much do existing customers contribute to my revenue? What is the volume of new customers?)
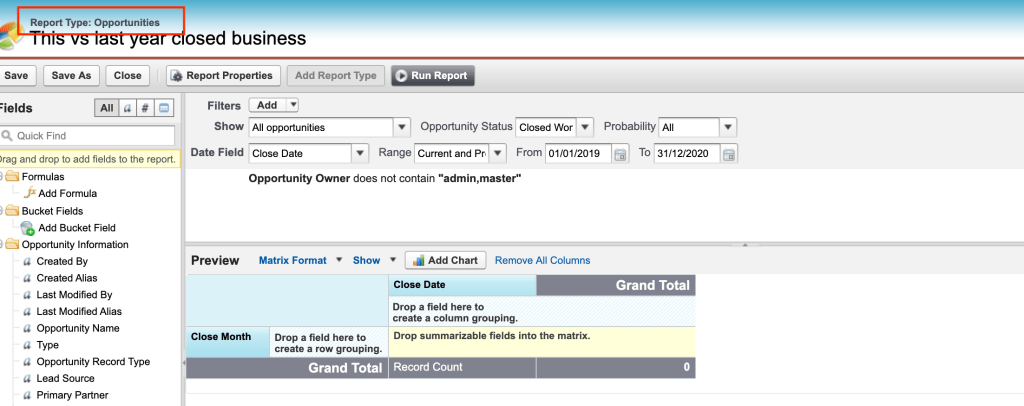
21. This vs last year closed business – (Compare actual sales to last year’s Sales Volume)
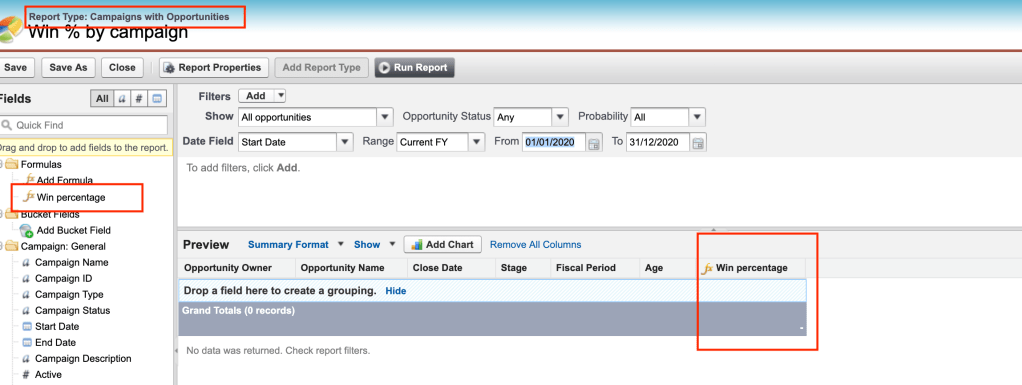
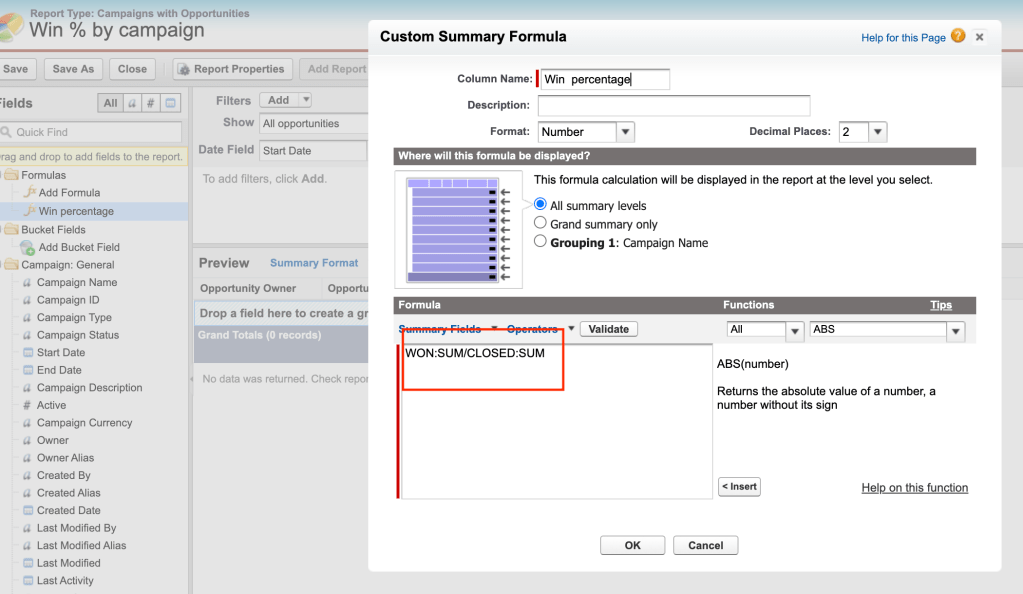
22. Win % by Campaign
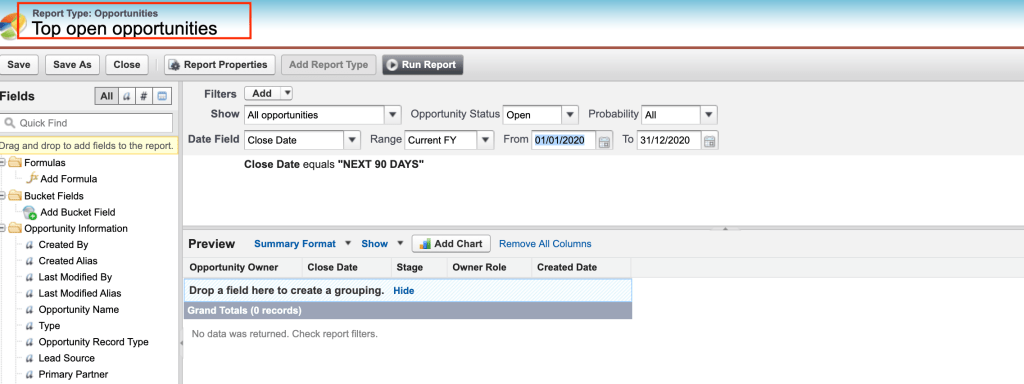
23. Top Open Opportunities – (Show me the Opportunities I have to monitor closely)
24. Win / Loss Ratio – (How many Opportunities get lost, How many are won?)

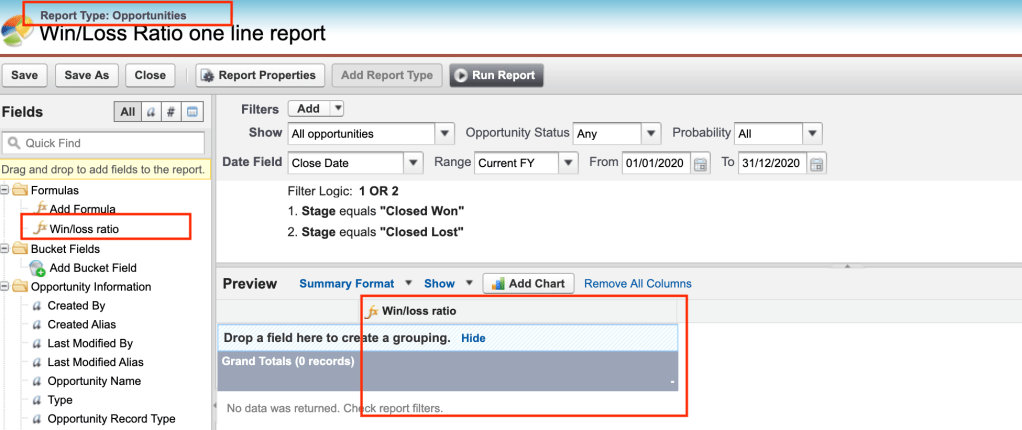
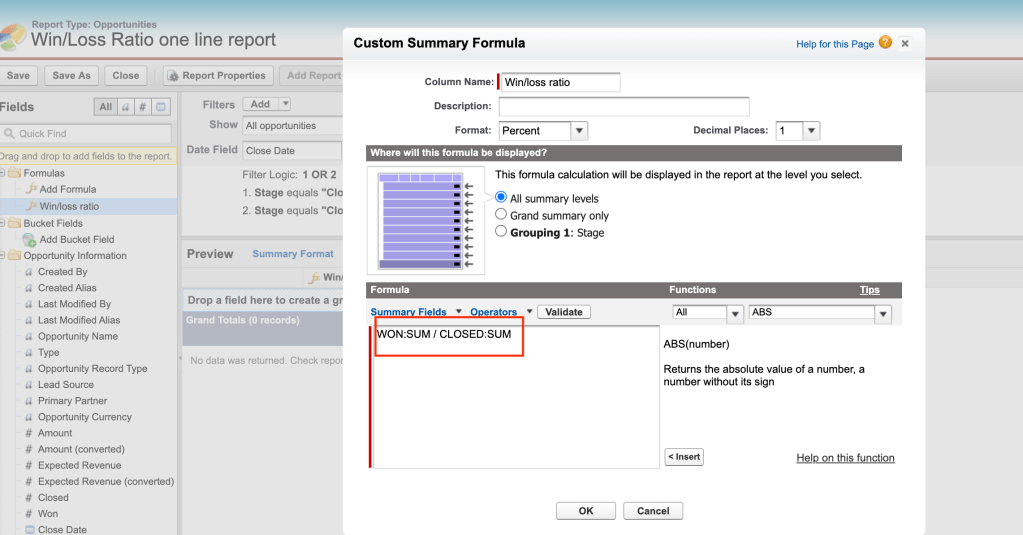
25. Win / Loss Ratio One Line report – (What is my ratio between won and loss opportunities?)